Reservoir Modeling
Exploratory visualization based on multidimensional transfer functions and star coordinates
Sibgrapi 2006 (XIX Brazilian Symposium on Computer Graphics and Image Processing): pp. 273-280 (October 2006)
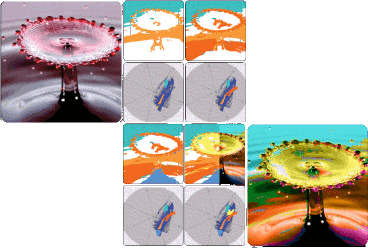
abstract
Abstract
Exploration and analysis of multivariate data play an important role in different domains. This work proposes a simple interface prototype that allows a human user to visually explore multivariate spatial objects, such as images, sequence of images or volume. It uses star coordinates as a widget to display the multivariate data on the computer 2D screen. The user then identifies a feature on this powerful coordinate system by mapping a selected feature region on that widget to a color and opacity. As a visual result, the feature is rendered on the objects space composing this map and the star coordinates projection. Some examples illustrate the potential of this interface.
downloads
Downloads
cite
BibTeX
@inproceedings{multi_transfer_sibgrapi,
  author        = {Alex Bordignon and Rener Castro and Hélio Lopes and Thomas Lewiner and Geovan Tavares},
  title         = {Exploratory visualization based on multidimensional transfer functions and star coordinates},
  year          = {2006},
  month         = {october},
  booktitle     = {Sibgrapi 2006 (XIX Brazilian Symposium on Computer Graphics and Image Processing)},
  pages         = {273--280},
  publisher     = {IEEE},
  address       = {Manaus, AM},
  doi           = {10.1109/SIBGRAPI.2006.17},
  url           = {https://thomas.lewiner.org/pdfs/multi_transfer_sibgrapi.pdf}
}
related